Market Update
Week Ending December 6, 2024
The Market Update is back after a week away. As a reminder, the Market Update is normally published weekly, with some exceptions, such as periods of slow economic or market news. To avoid confusion, at the end of each update, we provide advance notice if the following week will be skipped.

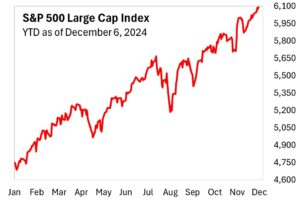
This past week saw the tech sector take over the leadership in the US stock markets with the NASDAQ 100 Index coming out on top versus the S&P 500 and Dow Jones 30 Indexes. Because many of these tech companies are very large and the index is weighted by market capitalization, their superior performance helped move the index higher, masking some weakness in the broader market as 7 out of the 11 economic sectors in the S&P 500 Index fell. The difference between the performance of growth versus value stocks was 5.53%, which is the largest margin since the week ending March 17, 2023. The chart to the right is the S&P 500 Index during 2024.
A strong US economy, good seasonality for the market, the potential for year-end performance chasing by money managers and a business-friendly administration taking office next year create a bullish backdrop for stocks that should continue to dominate investor psychology. As long as the economic data remains firm, inflation stays in check and bond yields do not creep too high, this bullishness should remain intact. Job growth was revived in November by delivering 227,000 new non-farm jobs, which was just above the consensus average of 218,000. Hourly average earnings also grew in November by 0.4%, which was above the estimate of 0.3%. The jobs news was not all positive though as the unemployment rate moved higher to 4.2%, and the labor force participation rate fell slightly.

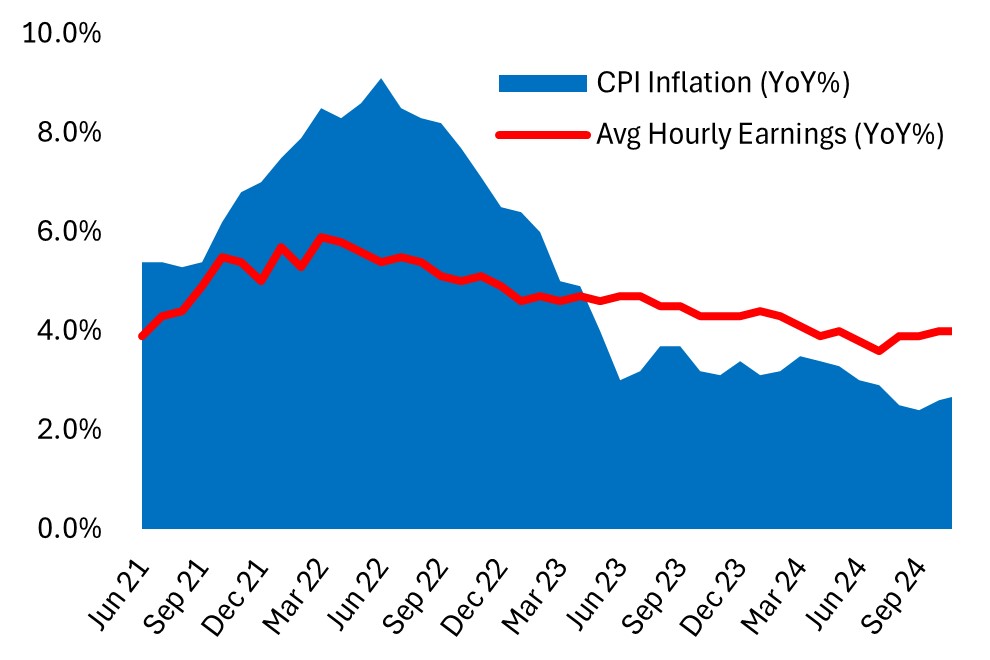
One important point of data that should continue to support consumerism in the US is the real wage gains being seen. Wage growth in the US has outpaced inflation since early 2023 (left chart) which should translate into excess dollars in Americans’ pocketbooks over time. This trend should continue as inflation is expected to remain restrained.
The US JOLTS report (Job Openings, Layoffs and Terminations) earlier in the week showed job openings in October grew to 7.74 million, up from 7.37 million in September. While the number of layoffs were little changed, the number of Americans quitting their jobs voluntarily increased to 3.3 million. Increasing voluntary job quits may reflect an increasing confidence by Americans of the ease of finding a better job.
The ADP National Employment Report also signaled good job performance as private employers added 146,000 new jobs in November with large employers reporting the strongest growth. While overall job growth was healthy, industry performance was mixed with manufacturing being the weakest along with financial services and hospitality remaining weak. The South saw the strongest job growth while the West and Midwest were the weakest.
Lastly, US interest rates fell as the US 10-year Treasury yield finished near a six-week low at 4.15% and has fallen 30 basis points over the last three weeks. These weakening interest rates are reflected in the average 30-year mortgage rates as the average rate, as reported by the Mortgage News Daily, fell to 6.68% as of the end of last week. While the holiday season is not usually a busy season for buying a new home, these lower rates will hopefully spur further growth in the US housing market. The chart to the right illustrates the 30-year mortgage rate during 2024.
Your Content Goes Here
| Index (ETF*) | January 10 YTD |
2024 Return |
1-Year Return |
5-Year Return |
10-Year Return |
|---|---|---|---|---|---|
| S&P 500 (SPY) | −0.96% | +24.89% | +24.89% | +24.89% | +24.89% |
| NASDAQ 100 (QQQ) | −0.96% | +24.89% | +24.89% | +24.89% | +24.89% |
| Dow Jones 30 (DIA) | −0.96% | +24.89% | +24.89% | +24.89% | +24.89% |
| Developed Non-US (EFA) | −0.96% | +24.89% | +24.89% | +24.89% | +24.89% |
| Emerging Markets (EEM) | −0.96% | +24.89% | +24.89% | +24.89% | +24.89% |
| Core Bonds (AGG) | −0.96% | +24.89% | +24.89% | +24.89% | +24.89% |